蓝屏是系统崩溃。操作系统在遇到致命错误导致崩溃时,并不是直接挂掉,而是会记录下当时内存中的数据,将其存储成为dump文件,并用一串蓝屏代码向用户做出提示。
一、如何获取DUMP文件
右键点击“我的电脑”,选“属性→高级→启动和故障恢复→设置”,打开“启动和故障恢复”选项卡,在“写入调试信息”下拉列表中选中“小内存转储(64KB)”选项,如下图:

选好后点确定,下次再出现蓝屏时,系统就会存储下dump文件,一般存放位置在系统盘的minidump文件夹下。(建议在该文件夹上点右键——属性——发送到——桌面快捷方式,以后就能在桌面上找到该文件夹了)。
小知识:小内存转储
内存转储是用于系统崩溃时,将内存中的数据转储保存在转储文件中,供给有关人员进行排错分析使用。小内存转储,就是只保存内存前64KB的基本空间数据的内存转储文件。这样可以节省磁盘空间,也方便文件的查看。选好后点“确定”,这样操作系统在下次出现蓝屏时,就会记录下当时内存中的数据,并存储为dump文件,该文件存放在系统盘的minidump文件夹下。
小知识:Dump文件
Dump文件是用来给驱动程序编写人员调试驱动程序用的,这种文件必须用专用工具软件打开,比如使用WinDbg打开。
第二步,下载安装windbg并安装
http://www.microsoft.com/whdc/devtools/debugging/installx86.mspx
第三步,使用windbg诊断蓝屏错误
遇到计算机蓝屏后重启,在minidump文件夹下会出现一个以日期为文件名的文件,那就是我们要的了。接下来打开windbg软件启动,File—>Open Crash Dump,如图:

然后找到你的minidump文件夹,dump文件一般是”时间.dmp”打开后就会自动分析了。
分析完后,看最下面,找到probably caused by这一行,如图:

那个360AntiArp.sys文件就是问题所在(举例,仅供参考),根据相关的文件名,在硬盘内查找和该文件相关的程序,排除该程序的影响后,确认是否还有蓝屏问题出现。
【注】导入dump文件分析完毕后,不要关闭,在命令行里面输入 !analyze -v ,这个命令可以查看dump文件的详细情况,对普通用户有用的还有下面一些信息:
0:000>!analyze -v
*******************************************************************************
* *
* Exception Analysis *
* *
*******************************************************************************
*** WARNING: Unable to verify checksum for testflash.exe
*** ERROR: Module load completed but symbols could not be loaded for testflash.exe
*** WARNING: Unable to verify checksum for flashgame.dll
*** ERROR: Symbol file could not be found. Defaulted to export symbols for flashgame.dll –
*** WARNING: Unable to verify checksum for yyyclient.dll
*** ERROR: Symbol file could not be found. Defaulted to export symbols for yyyclient.dll –
*** ERROR: Symbol file could not be found. Defaulted to export symbols for SKCHUI.DLL –
*** ERROR: Module load completed but symbols could not be loaded for xpsp2res.dll
*** ERROR: Symbol file could not be found. Defaulted to export symbols for MSOXMLMF.DLL –
*** ERROR: Symbol file could not be found. Defaulted to export symbols for RTXOLAss.dll –
*** WARNING: Unable to verify checksum for DS40xxSDK.dll
*** ERROR: Symbol file could not be found. Defaulted to export symbols for DS40xxSDK.dll –
*** WARNING: Unable to verify checksum for ClientPlayM4.dll
*** ERROR: Symbol file could not be found. Defaulted to export symbols for ClientPlayM4.dll –
*** ERROR: Symbol file could not be found. Defaulted to export symbols for rsaenh.dll –
*** ERROR: Symbol file could not be found. Defaulted to export symbols for safemon.dll –
*** ERROR: Module load completed but symbols could not be loaded for shdoclc.dll
*** ERROR: Symbol file could not be found. Defaulted to export symbols for sysfer.dll –
*** ERROR: Symbol file could not be found. Defaulted to export symbols for mswsock.dll –
*** ERROR: Symbol file could not be found. Defaulted to export symbols for psapi.dll –
*** ERROR: Symbol file could not be found. Defaulted to export symbols for user32.dll –
*************************************************************************
*** ***
*** ***
*** Your debugger is not using the correct symbols ***
*** ***
*** In order for this command to work properly, your symbol path ***
*** must point to .pdb files that have full type information. ***
*** ***
*** Certain .pdb files (such as the public OS symbols) do not ***
*** contain the required information. Contact the group that ***
*** provided you with these symbols if you need this command to ***
*** work. ***
*** ***
*** Type referenced: IMAGE_NT_HEADERS32 ***
*** ***
*************************************************************************
WARNING: lient overlaps testflash
WARNING: lient overlaps flashgame
WARNING: lient overlaps yyyclient
WARNING: lient overlaps SKCHUI
WARNING: lient overlaps xpsp2res
WARNING: lient overlaps MSOXMLMF
WARNING: lient overlaps RTXOLAss
WARNING: lient overlaps Flash10
WARNING: lient overlaps DS40xxSDK
WARNING: lient overlaps ClientPlayM4
WARNING: lient overlaps rsaenh
WARNING: lient overlaps safemon
WARNING: lient overlaps shdoclc
*** WARNING: Unable to verify timestamp for lient.dll
*** ERROR: Module load completed but symbols could not be loaded for lient.dll
*************************************************************************
*** ***
*** ***
*** Your debugger is not using the correct symbols ***
*** ***
*** In order for this command to work properly, your symbol path ***
*** must point to .pdb files that have full type information. ***
*** ***
*** Certain .pdb files (such as the public OS symbols) do not ***
*** contain the required information. Contact the group that ***
*** provided you with these symbols if you need this command to ***
*** work. ***
*** ***
*** Type referenced: kernel32!pNlsUserInfo ***
*** ***
*************************************************************************
*************************************************************************
*** ***
*** ***
*** Your debugger is not using the correct symbols ***
*** ***
*** In order for this command to work properly, your symbol path ***
*** must point to .pdb files that have full type information. ***
*** ***
*** Certain .pdb files (such as the public OS symbols) do not ***
*** contain the required information. Contact the group that ***
*** provided you with these symbols if you need this command to ***
*** work. ***
*** ***
*** Type referenced: kernel32!pNlsUserInfo ***
*** ***
*************************************************************************
FAULTING_IP:
lient+528d873
0528d914 8a08 mov cl,byte ptr [eax]
EXCEPTION_RECORD: ffffffff — (.exr 0xffffffffffffffff)
ExceptionAddress: 0528d914 (lient+0x0528d873)
ExceptionCode: c0000005 (Access violation)
ExceptionFlags: 00000000
NumberParameters: 2
Parameter[0]: 00000000
Parameter[1]: 07889000
Attempt to read from address 07889000
DEFAULT_BUCKET_ID: INVALID_POINTER_READ
PROCESS_NAME: testflash.exe
【略】
———
在上面显示的详细分析数据中:
DEFAULT_BUCKET_ID: 错误类型,这个需要编程和操作系统内核知识的工程师用得上;
PROCESS_NAME: XXX.exe 这个是导致错误的进程,查出是什么文件导致的蓝屏后,再看这里就知道是谁调用了错误文件,比如你查出testflash.sys导致蓝屏,但你查不到testflash.sys是哪个程序调用的,就可以用这个方法来看看,比如查出了是testflash.exe,你就可以在机子上或者网上搜索相关信息了。
附:
windbg基本调试命令:
r:可以显示系统崩溃时的寄存器和最后的命令状态。
dd:显示当前内存地址,dd 参数:显示参数处的内存。
u:可以显示反汇编的指令
!analyze –v:显示分析的详细信息。
kb:显示call stack 内容
bugcheck:可以显示出错的代码
未经允许不得转载:烂泥行天下 » 烂泥:Windbg 分析Windows蓝屏原因的方法
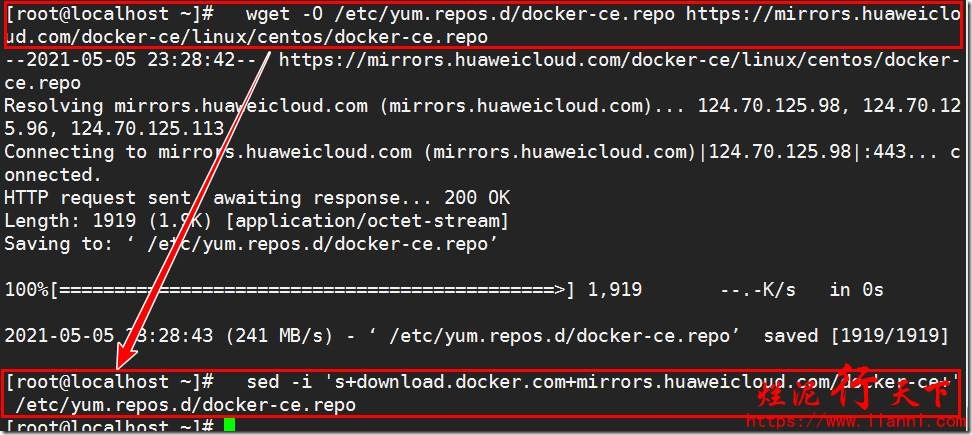 烂泥:OpenLDAP安装与配置,通过docker方式(三)
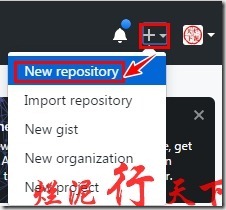 烂泥:通过docker加速下载国外文件
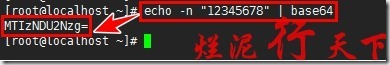 烂泥:base64加密与解密
 烂泥:jfrog artifactory的安装与使用
 烂泥:yum安装php5.6
 烂泥:openldap主从搭建与配置
 烂泥:squid与openldap集成
 烂泥:squid代理服务器安装与配置
